For Dashboard Designers Graphileon Architecture
Friday, November 11, 2022 12:52 PMArchitecture of Graphileon

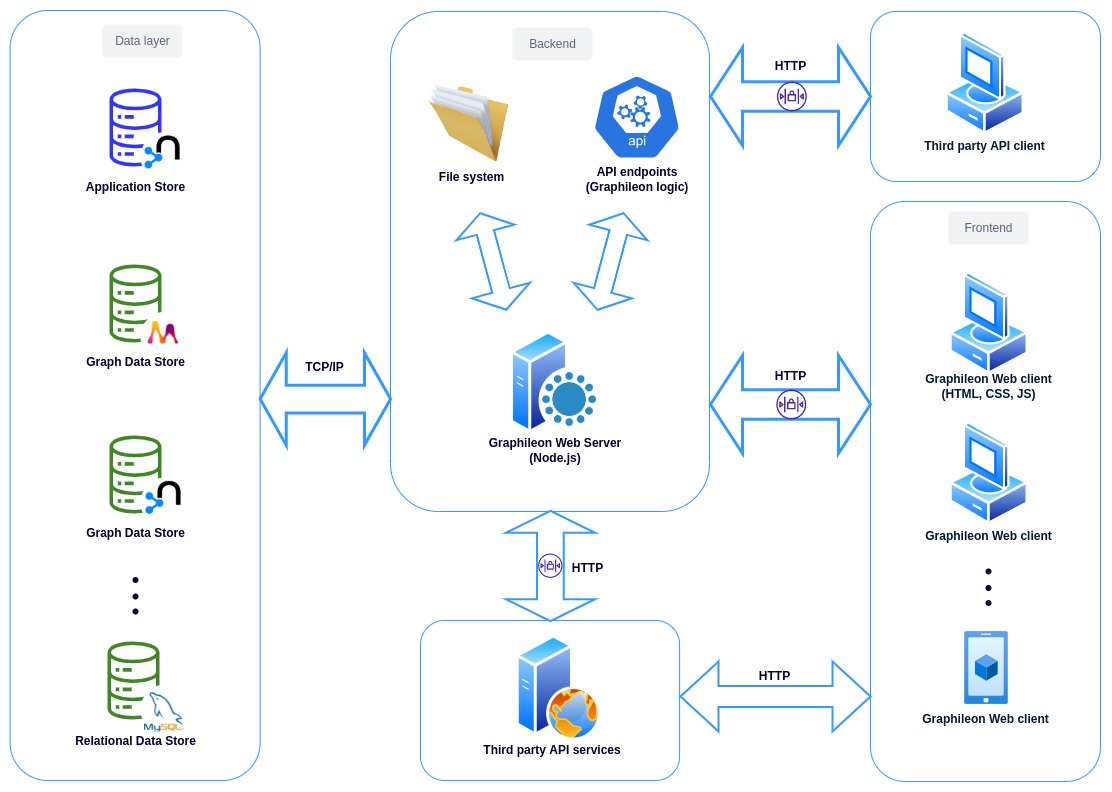
Graphileon is a web application with 2 major parts:
- the server side, running on the server infrastructure
- client side that is executed in the user's web browser
Both sides can execute configured Graphileon application logic, what we call an "application as a graph".
The Graphileon server can be configured to communicate to one or multiple databases (we call them "stores"). One store is required to hold the configured application logic. We name this the "application store". This store can also hold business data but we usually tend to separate it from the application logic data.
The server application is already a web server so there is no need to install one (like apache or nginx). A user accesses the client application by loading a web page from a preconfigured URL.
Graphileon provides a permissions system that allows fine-grained control over user and team access to data, dashboards and functions. In the diagram the arrows marked with a lock represent communication paths that are controlled by the permissions system. Anonymous usage of applications is also possible.
Custom API endpoints (private as well as public) can be configured in Graphileon which can be used by third party applications or users to access data from the stores in a controlled way. Graphileon can communicate with third party services or APIs either from the client side (browser application) or from the server side (as part of a custom API).
Technical details
Graphileon is written in JavaScript/Node.js.
We use the following libraries (selection)
For backend:
- express.js - handling HTTP server
- Passport js - 3rd party authentication (like OAuth2)
- axios - backend requests
- i18next - internationalization
- socket.io - WebSocket
For frontend:
-
VUE JS - frontend framework
-
jQuery - frontend DOM manipulation
-
Twitter Bootstrap - CSS Framework
-
FontAwesome - icons
-
navigo - URL routing
-
esprima - code evaluation
-
D3.js - graph visualization
-
yFiles for HTML - graph visualization
-
jqWidgets - html/js widgets
-
AgGrid - Excel like grid
-
Google Maps
-
Google Charts
-
charts js
-
vue-form-generator - dinamic forms
-
codemirror - code editing
-
jsPanel - window like panels
-
markdown-it - markdown to HTML
-
prosemirror - rich editor
-
socket.io - WebSocket communication
-
vis-timeline - timeline view
A complete list of libraries can be found here